
The Better Frozen Dessert Depends on the Label
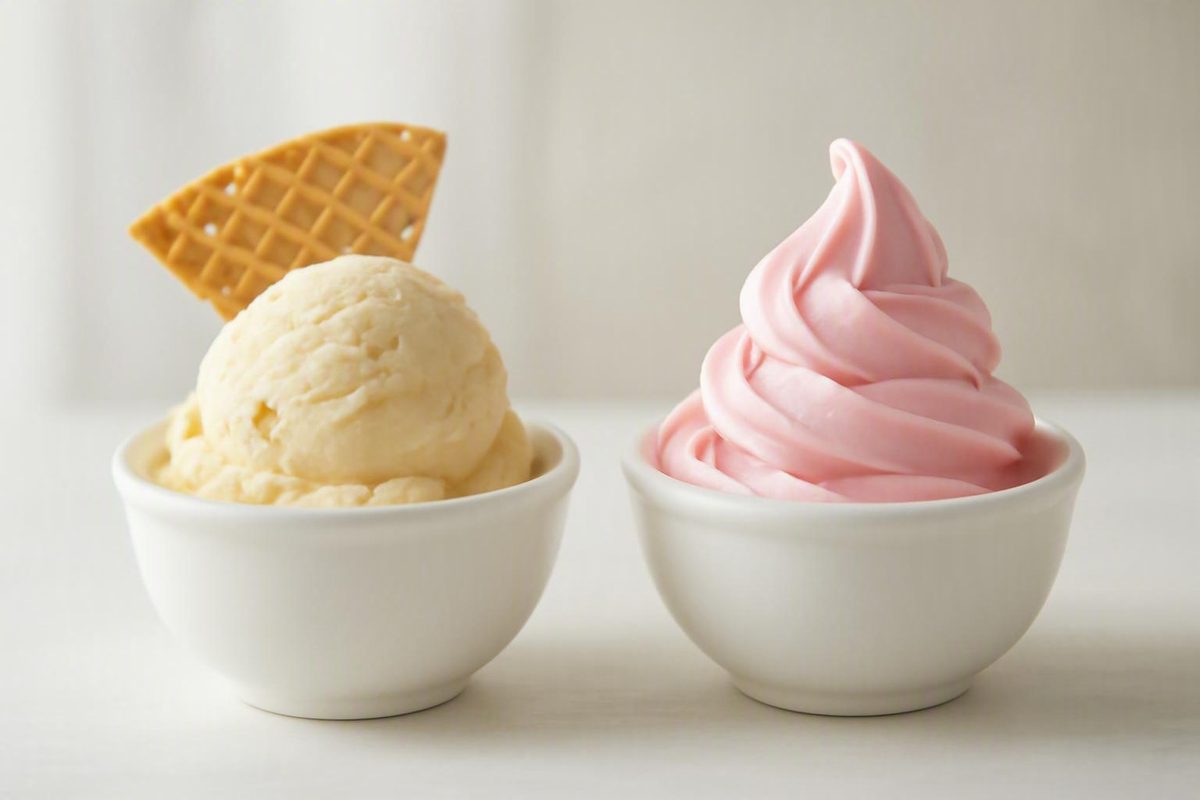
One half-cup comparison weighs ice cream at 67 g and frozen yogurt at 87 g. A fair label check normalizes both to 100 g, then accounts for your actual portion.
The short answer: neither dessert always wins
If you are deciding between ice cream or frozen yogurt, neither is automatically the healthier choice. The answer depends on the specific products, how much you eat, what you add, and which nutritional number matters most to you.
Frozen yogurt often contains fewer calories and less total fat than regular or premium ice cream. That tendency is useful, but it is not a rule. Its sugar may be similar to—or higher than—ice cream’s, and nutrition professionals emphasize that brands, recipes, serving sizes, and toppings can substantially change the comparison (The Kitchn’s comparison of frozen yogurt and ice cream).
A low-fat or non-fat label answers only one question: how much fat the product contains. It does not tell you whether the dessert is low in calories, carbohydrates, total sugar, or added sugar. Reducing fat does not necessarily reduce sweeteners or total calories.
The most practical answer is goal-specific:
- For fewer calories: Frozen yogurt may have an advantage, particularly when the portion is modest, but compare the actual calorie labels.
- For less saturated fat: Frozen yogurt often has an advantage over cream-heavy ice cream, but verify the saturated-fat line.
- For less added sugar: Do not choose by category. Buy whichever specific product has less added sugar at an equivalent weight and in a realistic portion.
- For more protein: Ordinary versions of the two desserts tend to be fairly close. Check the label rather than assuming that yogurt means high protein.
- For enjoyment: Either can be a reasonable occasional dessert in an appropriately chosen portion.
The words ice cream and frozen yogurt provide a starting clue about formulation. They do not provide a complete nutritional verdict.
What makes ice cream different from frozen yogurt?
The two desserts generally begin with different dairy bases.
Ice cream commonly uses milk, cream, or both, along with sweeteners and flavorings. Stabilizers and emulsifiers may also be used to control texture and keep fat and water from separating. Frozen yogurt generally starts with cultured milk and commonly includes sweeteners, flavorings, stabilizers, and emulsifiers of its own.
These are broad formulation patterns, however, not guarantees about every product.
Healthline reports that a product sold as ice cream in the United States must contain at least 10% milk fat. The same secondary source describes full-fat frozen yogurt as typically containing 3% to 6% milk fat and low-fat frozen yogurt as typically containing 2% to 4% (Healthline’s ingredient and milk-fat comparison). These reported figures provide general context; they are not a substitute for the ingredient list and Nutrition Facts panel on a particular product.
Modern formulations can blur the distinction. A richer frozen yogurt may include cream or whole milk, while a lighter ice cream may contain less fat than a premium version. Two tubs sitting next to each other can consequently differ more than their category names suggest.
The word yogurt should not be interpreted too broadly. Frozen yogurt is generally made with cultured milk, but the name alone does not establish:
- How much cultured milk is in the finished recipe
- Whether viable cultures remain when the product is eaten
- How many viable organisms may be present
- Whether eating the product will produce a particular health benefit
If the base includes cream, substantial added sweeteners, or other calorie-dense ingredients, the finished frozen yogurt may not resemble the leaner product a shopper imagines. The ingredient list and nutrition label remain more informative than the category name.
Calories, fat, sugar, and protein: what the available comparisons show
Published comparisons illustrate the usual tradeoff, but they should not be mistaken for category-wide averages.
One Healthline example compares half a cup of full-fat vanilla ice cream with half a cup of frozen yogurt and reports the following values (Healthline’s half-cup nutrition comparison):
| Nutrient | Vanilla ice cream | Frozen yogurt |
|---|---|---|
| Calories | 140 | 111 |
| Total fat | 7 g | 3 g |
| Total carbohydrate | 16 g | 19 g |
| Protein | 3 g | 3 g |
| Serving volume | ½ cup | ½ cup |
| Serving weight | 67 g | 87 g |
The listed frozen yogurt has fewer calories and less fat, more carbohydrate, and the same protein. But the serving weights expose a major limitation: the half cup of ice cream weighs 67 grams, while the half cup of frozen yogurt weighs 87 grams. This is an equal-volume comparison, not an equal-mass comparison.
That distinction matters because the table compares nutritional concentration across different masses of food. To determine which product has fewer calories or less sugar at the same weight, you must normalize the figures. To estimate what you would consume from a measured half cup, the volume-based figures remain relevant. The two approaches answer different questions.
A separate half-cup comparison from Everyday Health reports the following figures (Everyday Health’s vanilla dessert comparison):
| Nutrient | Vanilla ice cream | Vanilla frozen yogurt |
|---|---|---|
| Calories | 137 | 114 |
| Total fat | 7.26 g | 4 g |
| Protein | 2.3 g | 2.9 g |
| Total carbohydrate | 15.6 g | 17.4 g |
| Total sugar | 14 g | 17.3 g |
In this example, frozen yogurt again has fewer calories and less fat, but it contains more carbohydrate and sugar. Protein differs by only 0.6 gram. These are illustrative figures for the products represented in that comparison, not definitive averages for every pint, scoop-shop recipe, or flavor.
Together, the examples demonstrate a recurring tradeoff: frozen yogurt may offer fewer calories and less fat while matching or exceeding ice cream’s sugar. Two examples cannot establish the nutritional profile of an entire category, but they show why lower fat and healthier are not interchangeable.
Total carbohydrate, total sugar, and added sugar are different
These label lines answer different questions:
Milk contains lactose, so a dairy dessert can show total sugar even if its added-sugar line is zero. Conversely, frozen yogurt can contain both naturally occurring lactose and added sweeteners.
That distinction is particularly important when comparing products labeled “no sugar added.” The phrase does not mean that the food contains no sugar. Naturally occurring milk sugar can remain, and the product may use a non-nutritive sweetener in place of added sugar.
Protein is usually not the deciding difference
The cited standard-product examples do not show a major protein advantage for either dessert. One lists 3 grams for both products. The other lists 2.3 grams for ice cream and 2.9 grams for frozen yogurt.
The word yogurt may make frozen yogurt sound like a high-protein food, but ordinary frozen yogurt is not necessarily comparable with strained refrigerated yogurt. Everyday Health reports that regular frozen yogurt generally contains less than 3 grams of protein per serving, while some Greek-style products may contain about 5 grams (Everyday Health’s discussion of frozen-yogurt protein). Those figures show why formulation matters; they do not establish a category-wide protein advantage.
The same caution applies to nutrients not included in the matched comparisons. It would be misleading to invent representative advantages for calcium, saturated fat, or other nutrients when comparable values are unavailable. If one of those nutrients matters to you, use the labels on the two products in front of you.
How to make a fair label-to-label comparison
The fairest comparison begins with two reasonably similar products. Standard vanilla frozen yogurt versus standard vanilla ice cream is more informative than non-fat frozen yogurt versus premium ice cream. Matching the flavor also reduces differences caused by cookies, chocolate pieces, caramel, nuts, or other inclusions.
Product tier matters because the descriptions signal different formulations:
- Standard ice cream is not necessarily comparable with premium ice cream.
- Non-fat frozen yogurt is not equivalent to full-fat or cream-enriched frozen yogurt.
- Plain or vanilla products are not directly comparable with loaded flavors containing sauces or solid mix-ins.
- Greek-style frozen yogurt may have a different protein profile from an ordinary version.
Once the products are reasonably matched, look at serving weight—not just serving volume.
One label might list a dessert per half cup and another per two-thirds cup. Values printed for a half cup should not be assumed comparable with another half cup until you inspect the number of grams.
Normalize both labels to 100 grams
Use this formula for each nutrient:
Nutrient per 100 g = nutrient per serving ÷ serving weight in grams × 100
Suppose a label lists 180 calories for an 85-gram serving:
180 ÷ 85 × 100 = about 212 calories per 100 grams
If a competing dessert lists 170 calories for 70 grams:
170 ÷ 70 × 100 = about 243 calories per 100 grams
The second dessert has fewer calories per labeled serving but more calories per equal weight. Neither figure is inherently wrong. The serving-based view describes what the label defines as one serving; the normalized view compares nutritional concentration.
Repeat the calculation for the nutrients relevant to your goal:
- Calories
- Saturated fat
- Added sugar
- Protein
Total fat and total sugar can also be useful, but saturated fat and added sugar give more specific information than broad category assumptions.
Compare concentration and likely intake
A per-100-gram calculation does not tell you how much you will actually eat. After normalizing the labels, estimate your real portion.
A dense ice cream might have more calories per 100 grams, for example, but you may intend to eat a smaller measured amount. A lower-calorie frozen yogurt may result in greater intake if you fill a large self-serve cup. A useful comparison therefore includes two views:
- Per 100 grams: Which product is more concentrated in calories, saturated fat, added sugar, or protein?
- Expected portion: What will your actual bowl, cone, or cup contain?
If you track intake, weighing the portion can improve the estimate. Otherwise, choose a clearly defined serving before eating instead of allowing the container or self-serve cup to determine the amount.
A compact comparison checklist
Use this sequence in the store or at home:
- Match the flavor. Compare vanilla with vanilla or chocolate with chocolate where possible.
- Identify the product type. Note whether each is standard, premium, low-fat, non-fat, Greek-style, or no-sugar-added.
- Check serving grams. Do not rely on cups alone.
- Normalize if necessary. Convert calories and key nutrients to a 100-gram basis.
- Compare your priority numbers. Focus on calories, saturated fat, added sugar, and protein.
- Include the complete dessert. Consider the cone, sauce, candy, cookie pieces, nuts, fruit, and other additions.
You do not need exact topping calculations to recognize that a heavily topped serving differs from the base dessert shown on the tub or machine.
Choose according to the number you want to reduce
“Healthier” is too broad to settle the ice cream or frozen yogurt question. One product can be lower in fat but higher in added sugar. Another can be lower in sugar but substantially higher in calories. The better choice depends on the variable you are trying to manage.
| Priority | Likely category tendency | What to verify | Main caveat |
|---|---|---|---|
| Fewer calories | Frozen yogurt often has an advantage | Calories at equal gram weight and in your intended portion | Rich frozen yogurt or a large serving can erase the advantage |
| Less total fat | Frozen yogurt commonly has an advantage | Total fat per equal weight | Whole-milk or cream-containing versions may be higher |
| Less saturated fat | Frozen yogurt often has an advantage over cream-heavy ice cream | Saturated fat on both labels | Do not infer saturated fat solely from total fat or category |
| Less added sugar | No category consistently wins | Added sugar per equal weight and expected portion | Some frozen yogurts contain as much or more sweetener |
| More protein | Ordinary versions are often similar | Protein per serving and per 100 grams | Greek-style products may differ, but the name is not proof |
| Preferred taste | Either can work in a deliberate portion | The amount you expect to eat and the complete dessert | Preference does not change the label values |
| Verified cultures | Some frozen yogurts may qualify | Product-specific live-and-active-culture information | The category name alone is insufficient |
If your priority is fewer calories
The available standard-product examples give frozen yogurt a calorie advantage. An appropriately portioned frozen yogurt is therefore a reasonable place to begin, especially when the alternative is a richer ice cream.
But begin is the important word. Check the actual label, compare gram weights, and account for the amount you will serve. A lower calorie count for a manufacturer-defined serving does not help if your portion is much larger.
If your priority is less total or saturated fat
Frozen yogurt commonly has an advantage because it generally uses cultured milk rather than relying as heavily on cream. The difference may be particularly large when non-fat frozen yogurt is compared with premium ice cream.
Still, total fat and saturated fat are not the same measure. Read the saturated-fat line directly. A richer frozen yogurt containing cream may not fit the usual category pattern, and a lighter ice cream may compare more closely than expected.
If your priority is less added sugar
Do not choose a category. Choose a label.
Some frozen-yogurt formulations may use added sweeteners partly to balance cultured milk’s tart flavor, so frozen yogurt can contain as much or more sugar than ice cream. The result varies by recipe rather than applying to every product (The Kitchn’s discussion of sugar differences). Compare the added-sugar lines at an equal weight and then calculate the amount in your intended portion.
Remember that total sugar is not interchangeable with added sugar. A dairy dessert with zero added sugar can still contain lactose, while another product’s total sugar may combine lactose with added sweeteners.
If your priority is more protein
Ordinary ice cream and frozen yogurt appear broadly similar in the supplied examples. A Greek-style frozen dessert may contain more protein, but that is a formulation-specific characteristic rather than a reliable category advantage.
If protein is a meaningful selection criterion, compare the protein line per 100 grams and in the portion you expect to eat. Do not infer a high amount from the word yogurt.
If taste is the priority
A modest portion of either dessert can be a practical choice. There is no need to label ice cream “bad” or frozen yogurt “good,” nor should frozen yogurt be treated as a product that automatically causes weight loss.
A dessert you enjoy in a planned amount may fit your priorities better than a supposedly lighter alternative served in a much larger cup. That is a portion-management observation, not a claim that one product produces greater physiological satisfaction.
This article provides general information, not individualized advice for diabetes, allergies, intolerances, or another medical condition. The CaloriePages Terms of Use recommend consulting a registered dietitian or physician before changing your diet, especially when a health condition is involved.
Does frozen yogurt really provide probiotics?
Frozen yogurt is commonly made from milk fermented with cultures. That establishes something about production, but not necessarily about the dessert when you eat it.
Several factors may affect whether viable organisms remain:
- Processing before freezing
- The freezing process
- Product formulation
- Storage conditions
- Time between production and consumption
It helps to separate three different claims:
- Cultures were used to make the product.
- Live cultures remain in the finished product when it is eaten.
- Eating the product provides a specific digestive or other clinical benefit.
The first generally describes how frozen yogurt is made. The second requires product-specific evidence or manufacturer information. The third requires substantially more evidence and should not be inferred from an ingredient list or a “live cultures” statement.
Secondary nutrition sources caution that processing and freezing may reduce or eliminate viable cultures, although survival can vary by product. It is therefore not defensible to describe every frozen yogurt as a probiotic food solely because cultures were used during production.
If cultures matter to you, look for an explicit, current statement from the manufacturer about live and active cultures in the finished product. Interpret that statement narrowly: it may indicate that viable cultures are present, but it does not automatically establish their quantity at consumption or prove a particular health outcome.
A retailer may make such a statement about its own products. For example, Corner Yogurt says its featured frozen yogurt contains live and active cultures (Corner Yogurt’s product comparison). This is a product-specific commercial claim from a business selling frozen yogurt, not evidence that all frozen yogurt contains viable cultures or provides digestive benefits.
The safest conclusion is simple: frozen yogurt may contain live cultures, but the category name is not proof. Verify the individual product if that feature influences your decision.
Portions and toppings can reverse the comparison
A small difference between two base desserts can become irrelevant once serving size and toppings change.
Imagine that frozen yogurt has fewer calories per 100 grams than the ice cream beside it. That advantage may persist in equal portions, but not necessarily when the frozen-yogurt cup contains much more food. Add candy pieces, cookie crumbs, sauces, syrups, or several toppings, and the complete dessert no longer resembles the nutritional profile of the base alone.
This is especially easy to overlook at self-serve shops. A large cup is a container, not a serving-size recommendation. Its capacity does not tell you how much frozen yogurt corresponds to the portion on a nutrition display, and the final amount can be difficult to estimate visually.
A practical approach is to make the portion decision before adding toppings:
- Choose a cup without treating its capacity as a target.
- Dispense one deliberate serving rather than repeatedly adding more.
- Select toppings after establishing the base portion.
- Consider the complete cup—not just the frozen yogurt—when comparing it with another dessert.
Fresh fruit or a modest amount of unsalted nuts can be comparatively restrained alternatives to multiple candies, syrups, sauces, and cookie pieces. Every topping still contributes to the final serving, however, and nuts can add meaningful energy when the portion is large.
Cones count too. A comparison between a bowl of frozen yogurt and an ice-cream cone is not simply a comparison of the two frozen bases. The cone, coatings, sauces, and other additions are part of the serving actually eaten.
There is no need to invent precise calorie totals when topping amounts and recipes are unknown. The useful conclusions are qualitative:
- A plain or lightly topped dessert is not nutritionally equivalent to a loaded one.
- A small base serving is not equivalent to a cup filled to capacity.
- Multiple additions can outweigh a modest calorie or sugar difference between the original products.
If you want numerical precision, use posted nutrition information or weigh packaged ingredients when practical. Otherwise, keep the comparison fair by choosing similar portions and including all major components.
Marketing terms and selective comparisons to watch
Front-of-package terms can describe formulation, but they should not be treated as health rankings.
Low-fat and non-fat
These terms refer to fat content. They do not promise low calories, low total carbohydrate, low total sugar, or low added sugar.
When fat is reduced, manufacturers may use different combinations of ingredients to produce the desired flavor and texture. You cannot determine the overall result without reading the complete label.
Premium
Products sold in this tier may be richer, but their actual calories, fat, sugar, and serving weight still need to be verified.
Putting non-fat frozen yogurt beside premium ice cream may produce a dramatic difference in calories and fat. It does not reveal the typical difference between all frozen yogurt and all ice cream; it reveals the difference between those two selected formulations.
Greek-style
The term itself does not guarantee a particular protein amount or establish overall healthfulness. Verify protein, calories, saturated fat, and added sugar on the label.
No sugar added
No sugar added does not mean sugar-free. Dairy ingredients can contribute naturally occurring lactose, so total sugar may remain above zero. The product may also use a non-nutritive sweetener instead of added sugar.
A retailer’s product provides a useful but limited illustration. Corner Yogurt lists its no-sugar-added non-fat frozen yogurt at 110 calories, 10 grams of total sugar, zero grams of added sugar, and about 4 grams of protein per two-thirds cup. It also says this type of product uses a non-nutritive sweetener such as sucralose or stevia (Corner Yogurt’s no-sugar-added product figures).
That example has important limitations. It comes from a frozen-yogurt retailer rather than an independent matched-product study. The page also gives inconsistent figures for naturally occurring sugar—10 grams in its table and approximately 9 grams in accompanying text. Its broader comparison places selected non-fat frozen yogurts against Häagen-Dazs Vanilla, a premium ice cream, which magnifies the apparent category difference.
The comparison may reproduce the selected labels, but it cannot establish that every frozen yogurt is lower in calories, fat, or sugar than every ice cream.
“Low” claims can hide a different tradeoff
A product promoted as low-fat may still contain substantial sugar or calories. A no-sugar-added product may contain lactose and non-nutritive sweeteners. A Greek-style option may provide more protein but also differ in serving size, fat, or sweeteners. A premium product may be richer but eaten in a smaller portion.
Broad online averages should also be treated cautiously when the brand selection and calculation method are unclear. One registered-dietitian practice blog, for example, publishes category figures while acknowledging that product type and toppings can determine the result, but it does not provide a visible dataset or method sufficient to treat those figures as authoritative category values (EatWellGuru’s comparison discussion).
Marketing language is most useful as a cue to investigate, not as a final verdict.
Six things to check before buying
Whether the container says ice cream or frozen yogurt, inspect these six items:
- Serving grams: Are the products measured at the same weight?
- Calories: What is the value per equal weight and in your likely portion?
- Saturated fat: Does the creamier product actually contain substantially more?
- Added sugar: Which specific label is lower?
- Protein: Is any apparent advantage large enough to matter to your comparison?
- Live-culture statement: If cultures matter, does the manufacturer make a product-specific claim about the finished food?
Frequently asked questions
Does frozen yogurt usually have fewer calories than ice cream?
Often, but not always. The cited standard-product examples list fewer calories for frozen yogurt, but the result depends on the formulation and serving weight. Compare calories per 100 grams, then account for the amount you expect to eat.
Can frozen yogurt contain more sugar than ice cream?
Yes. Frozen yogurt can contain as much or more total or added sugar even when it has less fat. Check total sugar and added sugar separately because total sugar also includes naturally occurring lactose.
Is no-sugar-added frozen yogurt sugar-free?
Not necessarily. Milk contains lactose, so no-sugar-added frozen yogurt can still show total sugar on its label. It may also use a non-nutritive sweetener. Treat “no sugar added” as a formulation description, not as a synonym for sugar-free.
Does frozen yogurt always contain live probiotics?
No. Cultures may be used during production, but that does not prove viable organisms remain through processing, freezing, storage, and consumption. Look for current, product-specific information, and do not treat a culture statement as proof of a clinical benefit.
What is the fairest way to compare ice cream and frozen yogurt labels?
Compare similar flavors and product tiers, then check serving weight in grams. If the weights differ, convert calories, saturated fat, added sugar, and protein to a per-100-gram basis:
Nutrient per 100 g = nutrient per serving ÷ serving grams × 100
Then compare the portion you realistically plan to eat and include the cone, sauces, candy, fruit, nuts, and other toppings.
The words ice cream and frozen yogurt provide only a starting clue. Frozen yogurt often offers fewer calories and less fat, but sugar, formulation, portion size, and toppings can change the result. The most defensible choice is to compare similar products by gram weight, check calories, saturated fat, added sugar, and protein, include everything you expect to eat, and choose according to your actual priority rather than treating either category as an automatic winner.