
Unpacking Sugar Loads in Fizzy Drinks: Which Tops the Charts Per Label Data?
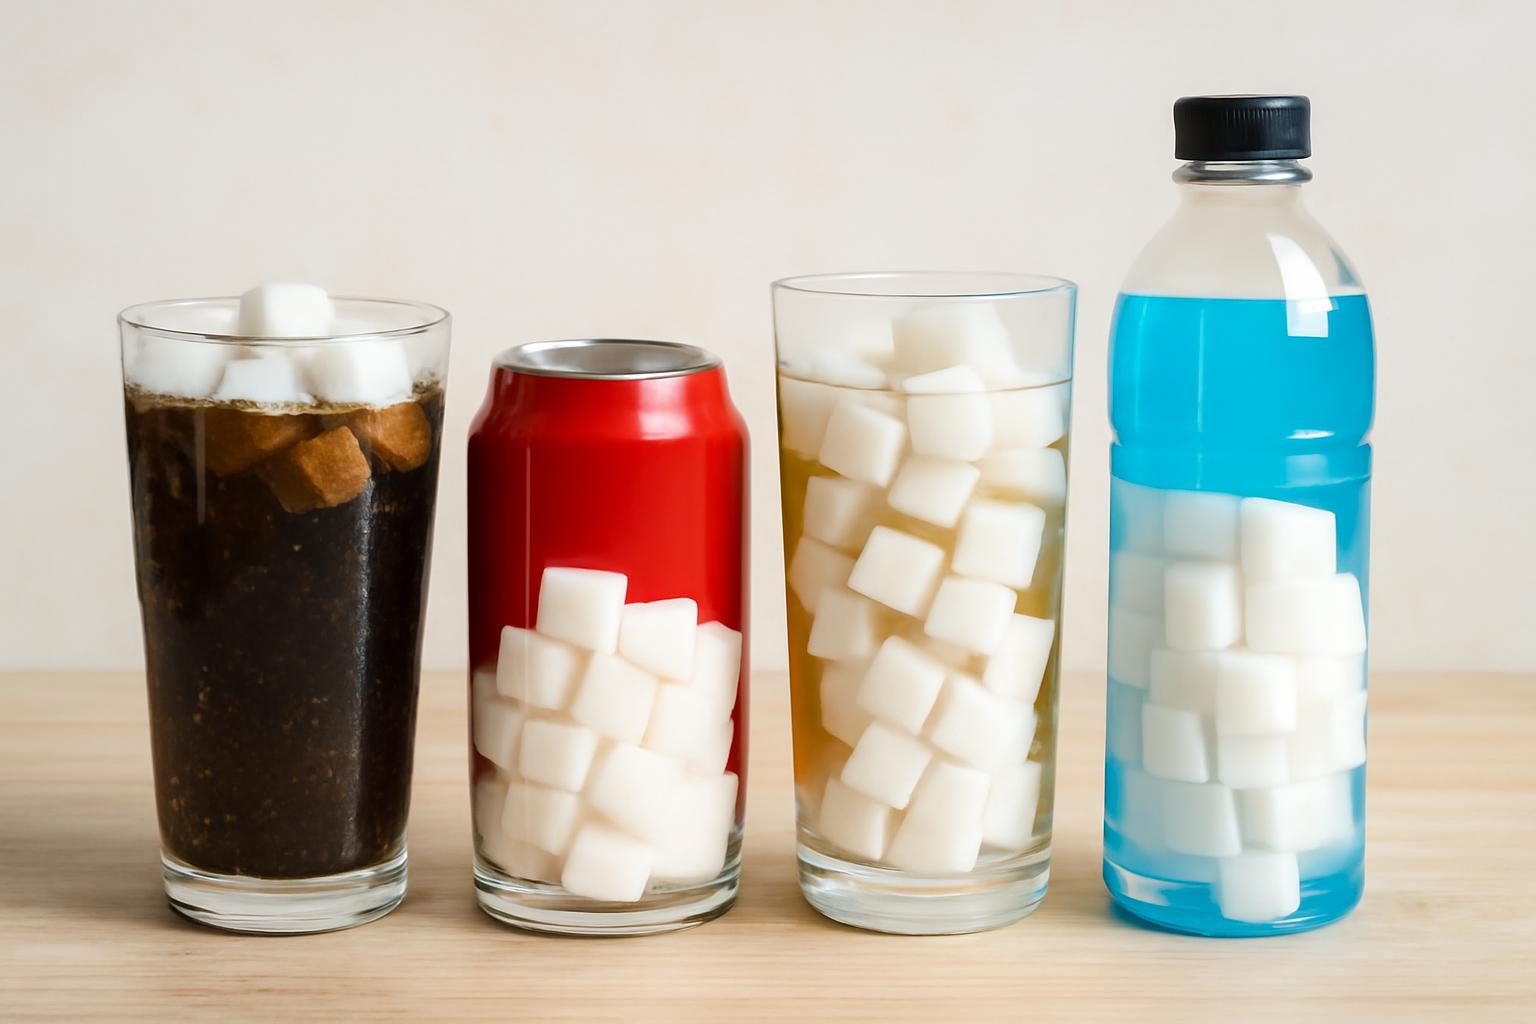
Among larger fizzy energy drinks, Rockstar Super Sours reaches 83.5g per 500mL. See how package total, density and standard soda rankings differ.
Unpacking Sugar Loads in Fizzy Drinks: Which Tops the Charts Per Label Data?
If you want the short answer to what fizzy drink has the most sugar, there is no single winner unless you first define category, serving size, and region.
Based on the label data in the evidence reviewed here:
- Among standard-size traditional sodas, the clearest repeat leader is Mountain Dew at 46.1g of sugar per 375mL, which closely matches about 46g per 12oz in US comparisons.
- Among larger fizzy energy drinks, Rockstar Super Sours reaches 83.5g per 500mL, which is higher in total sugar than the sodas listed here.
- Among US regular sodas ranked by larger serving sizes, Mello Yello shows a median 77g per 20oz serving, which beats Mountain Dew in total grams because the bottle is much larger.
That means the most accurate answer is not “Brand X always has the most sugar.” It is:
- Pick the category: soda, energy drink, or broader sugary drink
- Pick the serving size: 250mL, 375mL, 500mL, 600mL, 12oz, 16oz, 20oz
- Pick the market: Australian and US formulas can differ
For calorie and macro trackers, that distinction matters. A drink that looks only a little bigger can add another 20 to 40 grams of sugar, which is the difference between fitting a beverage into your day and spending most of your daily sugar budget on one can or bottle.
Defining Fizzy Drinks and Sugar Metrics for Fair Comparisons
The first problem with this question is scope. Many public rankings mix together all sugary drinks rather than only fizzy ones. That can mean soda, energy drinks, sports drinks, juice, and iced tea in the same table.
If you mean fizzy drink literally, the cleanest comparison is:
- Include carbonated soft drinks
- Include carbonated energy drinks
- Use sports drinks mainly as context, because they are often included in sugary-drink rankings even though many are not classic fizzy drinks in the same way soda is
- Exclude non-carbonated drinks such as juice and iced tea when answering the literal question
That distinction matters because a juice bottle can be very sugary without belonging in a true fizzy-drink ranking.
The second problem is the metric. Three different sugar views answer three different questions:
| Metric | What it tells you | Best use |
|---|---|---|
| Sugar per serving | Total grams in the can or bottle you actually drink | Real-world intake tracking |
| Teaspoons | A visual translation of sugar load | Quick mental picture |
| Sugar per 100mL | Sugar density independent of package size | Fair cross-brand comparison |
A practical conversion is about 4g of sugar per teaspoon. So:
- 46.1g sugar is about 11.5 teaspoons
- 39.8g is about 9.9 to 10 teaspoons
- 83.5g is about 20.9 teaspoons
For everyday tracking, per serving is usually the most useful number because that is what you consume. But for comparing a 250mL can, a 375mL soda, a 500mL energy drink, and a 600mL bottle fairly, per 100mL is the better lens.
Before treating any ranking as permanent truth, keep a few caveats in view:
- Serving sizes vary widely in the evidence here, from 250mL to 600mL and from 12oz to 20oz
- Regional formulations differ, especially between Australia and the US
- The data is time-bound: much of the evidence reflects tables reviewed or analyzed around 2020 to 2023
- Nutrition labels are approximate: CaloriePages notes that label calorie counts can be off by 20%, and reformulations or rounding can change published comparisons over time
So the most useful answer is not “this brand wins forever.” It is “here is the current label-based picture, and here is how to normalize it for the can or bottle in your hand.”
Traditional Sodas: Mountain Dew and Mello Yello Lead the Pack
If you narrow the question to traditional soda, two brands matter most, depending on the serving size you care about:
- Mountain Dew leads the more standard 375mL / 12oz-style comparison
- Mello Yello leads one US ranking when you allow a much larger 20oz serving
That is not a contradiction. It is a serving-size problem.
Mountain Dew is the best-supported leader in standard soda servings
Across the cleaner soda comparisons, Mountain Dew sits at 46.1g sugar per 375mL and 12.3g per 100mL. A separate US-style comparison also places it at about 46g per 12oz. Those figures line up closely enough to support the practical answer most readers want:
If you mean a mainstream soda in a normal can-sized serving, Mountain Dew is the clearest leader in this evidence set.
That is the strongest supported soda claim available.
Mello Yello becomes the big-bottle leader
A separate US ranking that groups sugary drinks by brand medians places Mello Yello at 77g sugar per 20oz serving. That is much higher in total grams than Mountain Dew, but it is also a much larger package.
So Mello Yello matters if the question is:
Which regular soda delivers the highest sugar total in the larger bottle people often buy?
That is a real ranking, but it is not a like-for-like can comparison.
Traditional soda examples from the evidence
| Drink | Serving size | Sugar per serving | Sugar per 100mL | Notes |
|---|---|---|---|---|
| Mountain Dew | 375mL | 46.1g | 12.3g | Highest listed among 375mL soft drinks in the Australian table |
| Mello Yello | 20oz | 77g median | — | Highest median sugar among listed US regular sodas |
| Solo | 375mL | 43.1g | 11.5g | Very high for a standard soda can |
| Pepsi Original | 375mL | 40.9g | 10.9g | Slightly above Coke in like-for-like comparisons |
| Bundaberg Ginger Beer | 375mL | 40.5g | 10.8g | Sits in the same high-sugar cluster as cola |
| Coca-Cola | 375mL | 39.8g | 10.6g | Classic high-sugar benchmark |
| Dr Pepper | 12oz | about 41g | — | Typically lands close to Pepsi |
| Fanta | 12oz | 44g median across varieties | — | Varies by flavor and package size |
| Sprite | 375mL | 25.9g | 6.9g | Much lower in the Australian comparison |
How to handle the conflicting higher numbers for Fanta and Dr Pepper
Some lower-trust or promotional materials list much higher figures for brands like Fanta and Dr Pepper, including numbers such as 69g and 58g in a supposed 12oz comparison. The problem is that those same materials conflict internally with more standard values for drinks like Coke.
The safe editorial read is:
- Treat Mountain Dew at about 46g per 12oz or 46.1g per 375mL as well supported
- Treat Dr Pepper at roughly 41g per 12oz as the more believable standard-can figure
- Treat Fanta as variable by variety and bottle size, with 44g median a better-supported brand figure than the more extreme promotional numbers
- Avoid presenting those inflated soda-company comparison tables as verified standard-can values
So the practical soda ranking is not that every orange soda or pepper-style soda beats Mountain Dew. It is that Mountain Dew is the clearest leader in standard mainstream soda servings, while some much larger bottles can exceed it in total grams.
Energy Drinks: Higher Totals in Bigger Cans
If you widen the field from soda to fizzy energy drinks, the totals climb fast.
The clearest example is Rockstar Super Sours, listed at 83.5g sugar per 500mL, or 16.7g per 100mL. In the core table used here, that is the highest total sugar figure and also the highest sugar density.
Other energy-drink examples from the evidence:
| Drink | Serving size | Sugar per serving | Sugar per 100mL | Notes |
|---|---|---|---|---|
| Rockstar Super Sours | 500mL | 83.5g | 16.7g | Highest total and highest density in the core comparison |
| V Energy Drink | 500mL | 53g | 10.6g | Large total partly driven by can size |
| Mother | 500mL | 50.5g | 10.1g | Similar pattern to V |
| Red Bull | 250mL | 27.5g | 11.0g | Smaller can, still fairly dense |
| Rockstar | 16oz | 61.5g median | — | US brand-family median across analyzed varieties |
Two points matter here.
1. Yes, some fizzy energy drinks out-sugar sodas
If the question is simply which carbonated drink in this evidence carries the most sugar in one package, the answer is not Mountain Dew. It is Rockstar Super Sours at 83.5g per 500mL.
That is why broad searches for “most sugary fizzy drink” can produce mixed answers. A soda may lead among standard cans, but a bigger energy drink can beat it easily once larger formats enter the comparison.
2. Can size explains a lot, but not everything
Energy drinks are also a good example of why total sugar per serving can mislead if you do not also check per 100mL.
A 500mL can is not directly comparable to a 250mL can or a 375mL soda unless you normalize the numbers. Some energy drinks mainly look worse because the can is bigger. Others are genuinely more sugar-dense.
Rockstar Super Sours is both:
- high in total sugar
- high in sugar density
That is why it stays at the top whether you rank by serving or by 100mL.
By contrast, V at 53g per 500mL is a high total, but its 10.6g per 100mL is close to cola territory. The larger can magnifies the grams.
For readers logging intake, the lesson is simple: large energy drinks can outrun soda totals very quickly, and they belong in any serious answer to “what fizzy drink has the most sugar?”
Cola Comparisons: Pepsi Edges Coke Slightly
Cola is where many readers start, because the everyday question is often:
Is Coke or Pepsi worse for sugar?
By label sugar, Pepsi is slightly higher.
Coke vs Pepsi
The most consistent cola figures in the evidence are:
- Coca-Cola: 39g per 12oz, or 39.8g per 375mL, with 10.6g per 100mL
- Pepsi: 41g per 12oz, or 40.9g per 375mL, with 10.9g per 100mL
That gives Pepsi an edge of roughly 2g per 12oz.
For tracking, that is not a huge difference. Both drinks sit in the same broad bracket: roughly 40g of sugar per regular can. But if you want the literal label-based answer, Pepsi edges Coke.
Coke in larger bottles
Package size scales these numbers quickly. One listed 600mL Coca-Cola carries 63.6g sugar while remaining at 10.6g per 100mL.
That is exactly why per-serving comparisons can mislead. The formula may be essentially the same; the bottle just contains more of it.
Sprite and other mainstream soft drinks
Sprite is a good example of how much market and product variation can matter.
- One Australian comparison lists Sprite at 25.9g per 375mL and 6.9g per 100mL
- A US-style estimate places Sprite around 38g per 12oz
- A US brand-family ranking reports 36g median for Sprite at 12oz, with a wider range across 12oz to 20oz products
So you should not assume that one brand name guarantees one universal sugar number in every country and package.
Dr Pepper generally lands around 41g per 12oz in the more believable standard-can comparisons, which places it close to Pepsi and slightly above Coke.
Quick cola comparison table
| Drink | Standard serve | Sugar | Notes |
|---|---|---|---|
| Pepsi | 12oz / 375mL | 40.9 to 41g | Slightly above Coke |
| Coca-Cola | 12oz / 375mL | 39 to 39.8g | Very similar to Pepsi |
| Dr Pepper | 12oz | about 41g | Close to Pepsi in standard-can terms |
| Sprite | 375mL or 12oz | 25.9g to about 38g | Varies more by market and product line |
The practical answer is straightforward: Pepsi edges Coke slightly on sugar, but neither tops Mountain Dew among standard soda servings.
Normalized View: Sugar Per 100mL Leaderboard
If you want the fairest cross-brand comparison, use sugar per 100mL. This removes most of the bottle-size effect.
On that basis, the ranking from the core data is clear:
| Drink | Sugar per 100mL | Category |
|---|---|---|
| Rockstar Super Sours | 16.7g | Energy drink |
| Mountain Dew | 12.3g | Soda |
| Solo | 11.5g | Soda |
| Red Bull | 11.0g | Energy drink |
| Pepsi Original | 10.9g | Cola |
| Bundaberg Ginger Beer | 10.8g | Soda |
| Coca-Cola | 10.6g | Cola |
| V Energy Drink | 10.6g | Energy drink |
| Mother | 10.1g | Energy drink |
| Sprite | 6.9g | Lemon-lime soda |
| Gatorade | 6.0g | Sports drink benchmark |
| Powerade | 5.8g | Sports drink benchmark |
This view changes the conversation in a few important ways.
Rockstar is the density leader
Even if you ignore the larger 500mL can, Rockstar Super Sours still leads at 16.7g per 100mL. Its ranking is not just a package-size artifact. It is genuinely more sugar-dense than the sodas listed here.
Mountain Dew leads mainstream soda density
Among the regular sodas in the table, Mountain Dew at 12.3g per 100mL sits above Coke, Pepsi, Bundaberg Ginger Beer, and Solo.
That is why Mountain Dew keeps surfacing in soda-specific discussions. It is not only high in total sugar for a standard can; it is also unusually concentrated.
Cola sits in a tight cluster
Coke, Pepsi, and similar sodas bunch around 10 to 11g per 100mL. The difference between 10.6 and 10.9 is real but small. In normal tracking, the bigger lever is usually package size, not switching from Coke to Pepsi.
Sprite and sports drinks are materially lighter
In the evidence reviewed here, Sprite at 6.9g per 100mL is much lower than Mountain Dew or cola. Sports drinks such as Gatorade and Powerade at about 6g per 100mL are lower still.
Those sports-drink figures are useful for context even if they are not the cleanest examples of fizzy drinks.
If your goal is to identify the single densest fizzy drink in this data set, Rockstar Super Sours wins on a per-100mL basis.
US vs Australia: Regional Formulation Gaps
One of the hardest parts of label-based nutrition writing is that the same brand can look identical across countries while not being numerically identical.
The Australian comparison gives these standard-can examples:
- Mountain Dew: 46.1g per 375mL
- Coca-Cola: 39.8g per 375mL
- Pepsi Original: 40.9g per 375mL
- Sprite: 25.9g per 375mL
US-focused comparisons cluster similarly for the best-known colas and citrus sodas:
- Mountain Dew: about 46g per 12oz
- Coca-Cola: about 39g per 12oz
- Pepsi: about 41g per 12oz
- Dr Pepper: about 41g per 12oz
That is close enough to support the same broad pattern:
- Mountain Dew is unusually high
- Pepsi and Coke are close together
- Package size drives huge changes in total grams
- Some lemon-lime or fruit-flavored sodas vary more by market and product line
Where the US data changes the picture most is larger-serving soda. One US ranking places Mello Yello at 77g median sugar per 20oz serving, which makes it a standout in that market and package format.
The safest interpretation is:
- Australian 375mL data is useful for a fair same-size comparison
- US 12oz data supports a similar Mountain Dew-above-cola pattern
- US 20oz rankings can produce different winners because the servings are much larger
- You should always check your local label, because the same brand name is not a guarantee of the same formula everywhere
For precise tracking, the local can or bottle in front of you beats a generic international ranking every time.
Daily Limits and Calorie Impact
Once you translate these drinks into daily-budget terms, the numbers get more concrete.
A commonly used benchmark is the FDA recommendation of less than 50g of added sugar per day for adults eating a 2,000-calorie diet. Against that benchmark:
| Drink | Sugar per serving | Share of 50g daily limit |
|---|---|---|
| Mountain Dew (375mL) | 46.1g | about 92% |
| Rockstar Super Sours (500mL) | 83.5g | 167% |
| Pepsi (375mL / 12oz) | 40.9 to 41g | about 82% |
| Coca-Cola (375mL / 12oz) | 39 to 39.8g | about 78% to 80% |
| Sprite (375mL AU figure) | 25.9g | about 52% |
That means:
- one Mountain Dew gets you to almost the whole benchmark
- one Rockstar Super Sours goes well past it
- one standard Pepsi or Coke still uses most of that daily budget
Sugar calories
For calorie tracking, sugar contributes about 4 kcal per gram. That gives rough sugar-derived calorie totals of:
- Mountain Dew, 46.1g → about 184 kcal from sugar
- Rockstar Super Sours, 83.5g → about 334 kcal from sugar
- Coca-Cola, 39.8g → about 159 kcal from sugar
- Pepsi, 40.9g → about 164 kcal from sugar
That does not mean every calorie in the drink comes from sugar with perfect precision, but for standard sugary soft drinks it is a useful quick estimate of why liquid sugar matters in a deficit or maintenance plan.
For readers calibrating intake against TDEE, sugary drinks are easy to undercount because they add calories with low satiety. If your body-weight trend is not matching your logged intake, beverages are a sensible place to check. A useful starting framework is CaloriePages’ guide to what TDEE measures and how to calibrate it.
A note on label precision
Do not confuse this math with laboratory certainty. CaloriePages notes that food-label calorie counts can be off by 20%, and real products can be reformulated. Use the arithmetic, but do not pretend a nutrition label is exact to the decimal forever.
For intake management, consistent logging matters more than false precision.
How to Verify Sugar on Your Drink Label
If formulas change, seasonal flavors appear, or you buy the same brand in another country, the label in your hand beats any ranking table.
Here is the cleanest way to check it.
1. Read the serving size first
Before you look at sugar grams, confirm the serving:
- 250mL
- 330mL
- 375mL
- 500mL
- 600mL
- 12oz
- 16oz
- 20oz
This is where many comparison errors start. A bottle may represent the whole package, or it may contain more than one serving.
2. Find total sugars, and check added sugars if shown
For ranking drinks, the line you want is usually total sugars per serving. Some labels also show added sugars, which can help when available.
For soda and most energy drinks, there is usually little ambiguity: most of the meaningful carbohydrate load is sugar. But for comparison purposes, total sugar per serving is the key number.
3. Convert the number into the comparison you need
Use the view that matches your goal:
- Per can or bottle for real intake
- Per 100mL for fair cross-brand comparison
- Teaspoons for a quick visual check
Examples:
- 40g sugar ≈ 10 tsp
- 46g sugar ≈ 11.5 tsp
- 84g sugar ≈ 21 tsp
4. Re-check current formulations
Most public drink tables are snapshots. Much of the evidence behind this comparison comes from tables reviewed or analyzed around 2020 to 2023.
That is recent enough to be useful, but not recent enough to skip label verification. Flavors, recipes, and package formats can change. Even within one brand family, one variety can be much higher than another.
5. Use logs to test the real impact against TDEE
If you are tracking macros or body weight, do not stop at reading the label. Log the drink and compare your intake with your weight trend over a few weeks.
That matters because:
- label-based calorie arithmetic is approximate
- TDEE calculators are estimates, not direct measurements
- day-to-day scale weight can move for reasons unrelated to fat gain or loss
The point of label reading is not perfect certainty. It is to get good enough numbers to calibrate your intake against reality.
Frequently asked questions
Does Mountain Dew have more sugar than Coke or Pepsi?
Yes. In the best-supported standard-serving comparisons, Mountain Dew is higher than both.
- Mountain Dew: about 46g per 12oz or 46.1g per 375mL
- Coke: about 39g per 12oz or 39.8g per 375mL
- Pepsi: about 41g per 12oz or 40.9g per 375mL
So if you are comparing typical can-sized servings, Mountain Dew clearly beats both Coke and Pepsi on sugar.
Is Pepsi sweeter or higher in sugar than Coke?
By label sugar, Pepsi is slightly higher.
- Pepsi: about 41g per 12oz
- Coke: about 39g per 12oz
That is only a small gap, so both drinks remain in the same general high-sugar cola bracket. Perceived sweetness can differ for flavor reasons, but on sugar grams alone, Pepsi edges Coke.
Do energy drinks count as fizzy drinks with high sugar?
Many do, and they matter in this discussion because they can exceed soda totals by a wide margin.
The clearest example is Rockstar Super Sours at 83.5g per 500mL, with 16.7g per 100mL. Other examples in the evidence include:
- V Energy Drink: 53g per 500mL
- Mother: 50.5g per 500mL
- Red Bull: 27.5g per 250mL
So if you mean carbonated packaged drinks sold in the same aisle as soda, energy drinks absolutely belong in the high-sugar conversation.
What’s the sugar in teaspoons for top fizzy drinks?
Using about 4g of sugar per teaspoon, the top examples convert roughly like this:
- Rockstar Super Sours, 83.5g → 20.9 tsp
- Mello Yello, 77g → about 19.3 tsp
- Mountain Dew, 46.1g → 11.5 tsp
- Solo, 43.1g → 10.8 tsp
- Pepsi, 40.9g → 10.2 tsp
- Bundaberg Ginger Beer, 40.5g → 10.1 tsp
- Coca-Cola, 39.8g → 9.9 tsp
- Sprite, 25.9g → 6.5 tsp
That is often the fastest way to make the numbers feel real.
Has fizzy drink sugar changed since 2023?
Possibly, yes.
Some of the core figures used here were last reviewed in December 2023 or come from analyses around 2020. Brand formulas, flavor lineups, and package sizes can change after that. On top of that, label numbers should be treated as approximate rather than permanent.
So the safest answer is: maybe. Check the current nutrition label on the exact can or bottle you plan to drink.
If you want the cleanest bottom line, it is this: you cannot name one universal “most sugary” fizzy drink without specifying serving size and region. For standard soda servings, Mountain Dew is the clearest leader at 46.1g per 375mL. For larger fizzy energy drinks, Rockstar Super Sours reaches 83.5g per 500mL. On pure density, Rockstar also leads at 16.7g per 100mL.
For tracking, normalize the drink to the can in your hand, compare it against the 50g daily added-sugar benchmark, and log it against your actual intake and TDEE rather than relying on brand reputation alone. This article is for general informational purposes, not medical or dietary advice; if you have a health condition or need individualized guidance, consult a qualified professional.